(all stats below include games through February 9)
Up top, I’ll admit something about the post you’re about to read. It’s incredibly analytics dependent. We’re going to be looking back through recent history to compare this year’s two best teams, Gonzaga and Baylor, to the great teams of this century. The easiest way to do that is by looking at metrics that are relatively unchanged over that period, comparing this year’s teams to the best from past seasons, and looking for answers in the numbers. If the numbers don’t exactly jive with your memory of certain teams or if you’re the type of person who shudders at the thought of including any type of statistics beyond points and rebounds, well this isn’t the post for you.
If you are intrigued by that premise, however, there’s some more preamble we need to cover before getting deep into the details. We’re going to be relying heavily on Ken Pomeroy’s numbers from his site, KenPom.com. There are certainly other metrics and statisticians worth checking in with (Bart Torvik, for example), but because KenPom has been in the game for so long, his database is the most comprehensive and allows us the most complete look into the recent past.
KenPom’s most important metric, which he uses to rank every Division I men’s basketball team, is called Adjusted efficiency margin. It is, at face value, a measure of how a team has performed offensively and defensively, adjusted for the level of opponent that team has played. A team’s offensive efficiency measures their points scored per 100 possessions. KenPom then adjusts that for the quality of opponent. Defense works the same way. Then subtract adjusted defensive efficiency from adjusted offensive efficiency to find Adjusted efficiency margin. Essentially, you’re measuring how much better than the average opponent a team has played over 100 possessions.
Let’s use current top KenPom team Gonzaga as an example. The Zags are scoring 123.8 points per 100 possessions, when adjusted for opponent, second best in the nation. The Zags are allowing 88.29 points per possession on defense, sixth best in Division I. Simply subtract one from the other and Gonzaga has played 35.51 points better than the average Division I opponent this season. That Adjusted efficiency margin number is about as reliable of a catch-all metric you’re going to find for comparing teams across years and decades.
KenPom’s metrics go back to 2002. That gives us 20 total seasons of teams to compare, if you include this season. Gonzaga and Baylor both currently have an adjusted efficiency margin over 35. Only two other teams since 2002 have reached the NCAA Tournament with that high of a mark, 2018 Kentucky and 2019 Virginia.
To really understand how good these two teams are shaping up to be, I pulled the data from every team that entered the last 18 NCAA Tournaments with an Adjusted efficiency margin over 29.5, as well as every team in those 18 seasons that would go on to win the National Championship at season’s end. This excludes this year, obviously, and last year, because there was no NCAA Tournament. Here’s our findings from that data deep dive:
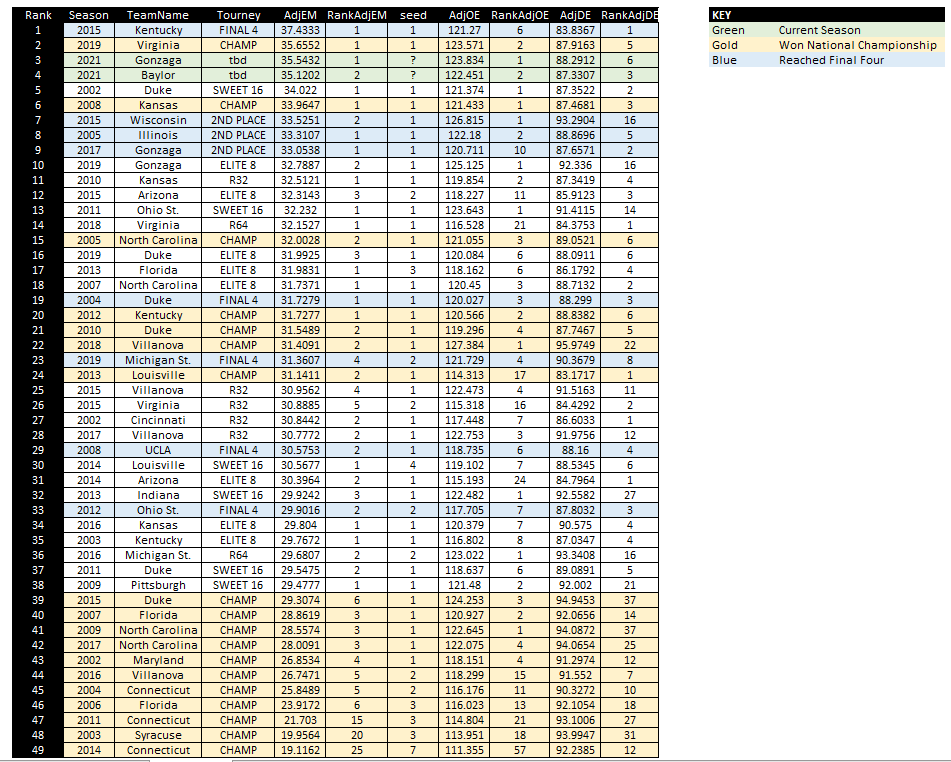
Gonzaga and Baylor are on track to both be historically great teams.
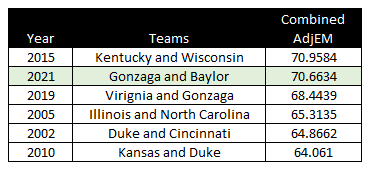
Currently, Gonzaga and Baylor are the 3rd and 4th best teams on that list of 49 teams. Their combined Adjusted efficiency margin would be the second highest of any two teams to enter the NCAA Tournament in the season season, trailing only 2015’s Kentucky and Wisconsin teams who met in the Final Four.
Now obviously, none of this means that either the Zags or Bears are guaranteed tournament success, though it certainly suggests they are equipped to make a deep run in March. Every other team in the top ten reached the second weekend of tournament play, with six of those eight teams advancing to the Final Four and two cutting down the nets as champions.
Extend out to the top 25 and those trends grow stronger. Seven of those 23 teams (again, not counting Baylor and Gonzaga) won the national title (30 percent) and 13 of those 23 reached the Final Four (57 percent). It remains to be seen if both Gonzaga and Baylor can survive the gauntlet of March Madness by winning four games and reaching the Final Four, but the numbers suggest at least one of them should be expected to do so.
March Madness is mad, for the most part.
There’s little belief that a 64-team, single-elimination tournament provides the best avenue for crowning the best team as champion at the end of the season. Is it the most entertaining way to choose a champion? Hell yeah.
But it’s far from the best way to make sure the best team cuts down the nets. In these numbers, that’s pretty clear, given that the bottom 11 teams on this list in terms of Adjusted efficiency margin went on to win the national final. Some of that is due to my methodology, by choosing a hard cut off analytically but also pulling in past champions as a comparison. On the other hand, the analytical performance of the champions is somewhat in favor of March Madness’ ability to choose a winner. Yes, the “best” team by the numbers doesn’t win every championship. But they shouldn’t. Not in any real life scenario. The by-the-book best team doesn’t win every championship in any league, especially not any that decides its champion with a playoff system.
The point of a playoff should be to have one of the best teams outperform the competition and deservedly walk away as winners. These numbers indicate that March Madness is doing just that, with a few outliers. Of the last 18 National Champions, 15 winners were one of the six best teams in their given season. The three outliers are 2003 Syracuse, 2011 UConn, and 2014 UConn, all of which shared some characteristics. Namely, all three featured an outsized dynamic scorer (Carmelo Anthony, Kemba Walker, and Shabazz Napier) who was able to push his team through its deficiencies for a title. An outlier once every six years on average seems about right (and means we’re due for a shocker in the near future…).
Quick sidenote: it is extremely funny that three of the five worst champions in the KenPom era came from the same school. Devil UConn magic has been dormant. It’s bubbling up.
Which teams does this suggest could win the 2021 National Championship?
Looking back at the pre-tournament position of our 18 most recent champions allows us to scan for some trends, which we can then apply to this season to see who might fit the bill of a champion. If you were looking for a duck and had a list of 18 ducks and their attributes, you’d be better served when you walked out into the aviary. Weird analogy but I stand by it.
Every one of the past 18 champions ranked in the top 25 of Adjusted efficiency margin entering the tournament. Obviously we have just over a month until the tournament begins, so teams will rise and fall, but as an exercise, let’s use the current analytics to sniff out teams that fit the bill. Simply snipping down to the top 25 cuts out 322 active college basketball teams.

Next up, every champion has ranked in the top 60 offensively. Of the current top 25, that eliminates one contender: Tennessee. The Vols currently have the top defense in college basketball, but it has been a struggle to find scoring in Knoxville. With their 61st offensive efficiency rating, we’ll cross them off our list.

Every recent champion has also had a top 40 ranked defense. That is much more limiting, cutting out five top 25 teams, some of which have championship aspirations.

Villanova, Colorado, West Virginia, and Ohio State all posses highly ranked offenses, but have had less success on the defensive end. Again, there’s time for them to improve before tournament play, yet strictly by the numbers, let’s cross them off. This also means we’ll be emphatically booting Iowa from our list. The Hawkeyes currently own the top offense in the nation, yet it is very difficult to imagine the 122nd ranked defense holding up for six tournament games.
Let’s hone things a little further to skim off our potential outliers. All but one recent champion had a top 25 ranked offense. That eliminates nine more teams from our current standing, although many are hovering around the watermark with a chance to rise before March.
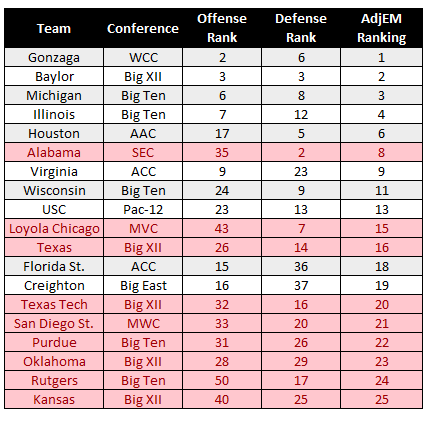
It’s perhaps most concerning for Alabama, currently sitting at 35th in adjusted offensive efficiency.
Zeroing in defensively, all but one recent title team was ranked in the top 31 of defensive efficiency (sure, we’re cherry picking these stats). That nixes Creighton and Florida State’s current teams from our list.
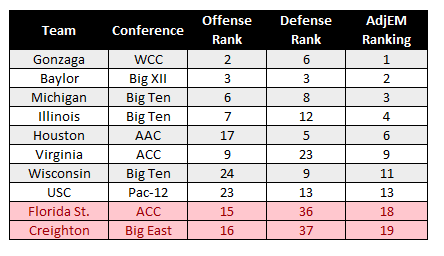
It leaves us with just eight remaining title contenders this season:

That feels like pretty good list. I think by the eye-test I’d like to see Villanova and Ohio State included on this list, but there’s something to be said for trusting the numbers. USC is certainly the most interesting name here. The Trojans have been quietly making a name for themselves in a less-than-impressive Pac-12 this season.
Now let’s execute one final cut. Excluding the outlier Syracuse and UConn teams, every champion entered the tournament in the top six of Adjusted efficiency margin. That would leave us with just five teams left.

These are currently five of the top six in Adjusted efficiency margin, excluding Iowa and its putrid defense. I’d feel fairly safe betting that one of these five will end the season as our champions. Clearly Baylor and Gonzaga are the favorites, with Michigan and Houston making a strong case, and Illinois sneaking in, with a chance for Ayo Dosunmu to be this year’s Carmelo or Kemba if the Illini are in need of an outlier type performance.
What about finding potential busts come tourney time?
Unfortunately, the data isn’t great in that regard. There’s no real way to know which teams performing at a historical level will suddenly get gobbled by a Cinderella. In 2010, Kansas was primed to be one of the best teams we’d ever seen until Ali Faroukmanesh came along. We all watched what happened to Virginia in 2018. The two teams prior and following Villanova’s 2016 National Championship were statistically better than the team that won it all, but both went home during the tournament’s first weekend.
March Madness may have trends and quirks, but there’s rarely blood in the water to indicate when a truly shocking upset will occur.
*******
Gonzaga might win it all. Maybe it will be Baylor. Perhaps our dreams will come true and they will play each other for the title. Maybe one will lose early on. It’s possible they both could lose early. The numbers suggest otherwise, but they have suggested plenty in the past. That’s why we watch the games.
*******
Shane McNichol is the founder, editor, and senior writer at PalestraBack.com. He has also contributed to ESPN.com, The Action Network, Rush The Court, Larry Brown Sports, RotoBaller, and USA Today Sports Weekly. Follow him on Twitter @OnTheShaneTrain. You can find every post from this blog on Twitter by following @PalestraBack.

One thought on “Placing Gonzaga and Baylor into Historical Context Helps Us Find Our 2021 National Champion”